Deploying this site with Zeet
This site has been around for quite a while now (obviously without very many updates). In fact, the last update was long enough ago that I didn't remember how to deploy it anymore. It had involved some complicated Taskcluster tasks that manually pushed things to s3 and such but it's been quite a while. In addition, it used Jekyll and I don't even have ruby installed on this machine at this point, nor did I feel like installing it just to hack on this.
It was time for a refresh.
I decided to port the static generation to Zola for no real reason other than that it looked nice. For hosting purposes, I wanted to try out something new so I am trying out Zeet. It is definitely feels a bit overpowered for deploying a single static site but who knows, maybe I'll build some more interesting bits into this eventually. Plus, it was time to get to know my old friend Kubernetes again after getting back from boat school and what better way than to use Zeet's expertise in setting up a correct deployment. It is interesting here because Zeet is just managing resources in your own cloud account, none of your services are actually running in Zeet itself.
Zeet is interesting because it is opinionated on the basics of how one would set up a deployment like this but extremely flexible after that. It looks to grow with you as your needs change and grow over time. This should hopefully avoid the dreaded feeling of being stuck in a Heroku deployment when you know you will need to move out of it soon to keep scaling or get some feature you can't achieve in their walls.
Zola-ification
This part was easy enough once I actually sat down and decided to do it. Ultimately the models of Zola and Jekyll are similar enough that 90% of the work is just cp-ing files around to new locations and updating a few things. It wouldn't be too hard to automate most of it if you had to move a large site but for me with my pitifully few posts, I just changed things manually. There are a few batteries included with Zola that made my life even easier as I could just dump some of the more complex pieces of my old setup (code highlighting, etc). The one thing I couldn't achieve in the time I set out for myself was to be able to inline css/js resources. This is something I had done on my blog a long time ago for the fun of trying to get pageload times as low as I could (obviously not really necessary in this context). So, with that in mind, now we just load them in with tags the old way. Ultimately this is probably nicer anyway.
With that complete and running locally, it was time to get it into a Docker image for deploying with Zeet.
A wrong turn
There are roughly two ways to deploy an app with Zeet -- Serverless and Kubernetes. I had never really used AWS Lambda before (which is what Zeet is configuring for me here) so I figured I would give it a try. I know it is a poor choice for a static site, but I figured I could hack it into working and learn something in the process. After a couple hours of poking around, I'm certain that you could make this sort of deployment work but it really is more work than you'd want and for no benefit. I did learn something at least. It's a neat tool and I could definitely see reaching for it later in a more appropriate scenario.
Back to Kubernetes
After I gave up with Serverless, I went back to my old friend Kubernetes. Zeet can set up and manage an EKS cluster for you and after deciding it was worth a few dollars to try this out (a running cluster costs whereas the Lambda functions are practically free for me unless somehow billions of people suddenly want to read my blog). All that was involved was clicking a few buttons, and a few minutes later I had a cluster up and running, ready for my image. The image itself is pretty straightforward.
FROM nginx:1.23.2-alpine

RUN apk add zola

ENV build /build

RUN mkdir $build
WORKDIR $build

COPY . .
RUN zola build
RUN mv ./public/* /usr/share/nginx/html
This probably isn't the optimal way of doing this but it is good enough for now! After the obvious faffing about that is always involved in getting ports and healthchecks to all line up correctly, I was rewarded with the page you're viewing currently.
Now all that was left to do was to write a new post about this experience and publish it here!
Fin.
Debugging Docker Connection Reset by Peer
co-written with Dustin Mitchell and cross-posted here
Symptoms
At the end of January this year the Taskcluster team was alerted to networking issues in a user's tasks. The first
report involved ETIMEDOUT but later on it became clear that the more frequent issue was involving ECONNRESET in the middle of downloading artifacts necessary to
run the tests in the tasks. It seemed it was only occurring on downloads from Google (https://dl.google.com) on our workers running in GCP, and only with relatively large artifacts. This led
us to initially blame some bit of infrastructure outside of Taskcluster but eventually we found the issue to be with how Docker was handling networking on our worker machines.
Investigation
The initial stages of the investigation were focused on exploring possible causes of the error and on finding a way to reproduce the error.
Investigation of an intermittent error in a high-volume system like this is slow and difficult work. It's difficult to know if an intervention fixed the issue just because the error does not recur. And it's difficult to know if an intervention did not fix the issue, as "Connection reset by peer" can be due to transient network hiccups. It's also difficult to gather data from production systems as the quantity of data per failure is unmanageably high.
We explored a few possible causes of the issue, all of which turned out to be dead ends.
- Rate Limiting or Abuse Prevention - The TC team has seen cases where downloads from compute clouds were limited as a form of abuse prevention. Like many CI processes, the WPT jobs download Chrome on every run, and it's possible that a series of back-to-back tasks on the same worker could appear malicious to an abuse-prevention device.
- Outages of the download server - This was unlikely, given Google's operational standards, but worth exploring since the issues seemed limited to
dl.google.com. - Exhaustion of Cloud NAT addresses - Resource exhaustion in the compute cloud might have been related. This was easily ruled out with the observation that workers are not using Cloud NAT.
At the same time, several of us were working on reproducing the issue in more controlled circumstances. This began with interactive sessions on Taskcluster workers, and soon progressed to a script that reproduced the issue easily on a GCP instance running the VM image used to run workers. An important observation here was that the issue only reproduced inside of a docker container: downloads from the host worked just fine. This seemed to affect all docker images, not just the image used in WPT jobs.
At this point, we were able to use Taskcluster itself to reproduce the issue at scale, creating a task group of identical tasks running the reproduction recipe. The "completed" tasks in that group are the successful reproductions.
Armed with quick, reliable reproduction, we were able to start capturing dumps of the network traffic. From these, we learned that the downloads were failing mid-download (tens of MB into a ~65MB file). We were also able to confirm that the error is, indeed, a TCP RST segment from the peer.
Searches for similar issues around this time found a blog post entitled "Fix a random network Connection Reset issue in Docker/Kubernetes", which matched our issue in many respects. It's a long read, but the summary is that conntrack, which is responsible for maintaining NAT tables in the Linux kernel, sometimes gets mixed up and labels a valid packet as INVALID. The default configuration of iptables forwarding rules is to ignore INVALID packets, meaning that they fall through to the default ACCEPT for the FILTER table. Since the port is not open on the host, the host replies with an RST segment. Docker containers use NAT to translate between the IP of the container and the IP of the host, so this would explain why the issue only occurs in a Docker container.
We were, indeed, seeing INVALID packets as revealed by conntrack -S, but there were some differences from our situation, so we continued investigating.
In particular, in the blog post, the connection errors are seen there in the opposite direction, and involved a local server for which the author had added some explicit firewall rules.
Since we hypothesized that NAT was involved, we captured packet traces both inside the Docker container and on the host interface, and combined the two. The results were pretty interesting! In the dump output below, 74.125.195.136 is dl.google.com, 10.138.0.12 is the host IP, and 172.17.0.2 is the container IP. 10.138.0.12 is a private IP, suggesting that there is an additional layer of NAT going on between the host IP and the Internet, but this was not the issue.
A "normal" data segment looks like
22:26:19.414064 ethertype IPv4 (0x0800), length 26820: 74.125.195.136.https > 10.138.0.12.60790: Flags [.], seq 35556934:35583686, ack 789, win 265, options [nop,nop,TS val 2940395388 ecr 3057320826], length 26752
22:26:19.414076 ethertype IPv4 (0x0800), length 26818: 74.125.195.136.https > 172.17.0.2.60790: Flags [.], seq 35556934:35583686, ack 789, win 265, options [nop,nop,TS val 2940395388 ecr 3057320826], length 26752
here the first line is outside the container and the second line is inside the container; the SNAT translation has rewritten the host IP to the container IP. The sequence numbers give the range of bytes in the segment, as an offset from the initial sequence number, so we are almost 34MB into the download (from a total of about 65MB) at this point.
We began by looking at the end of the connection, when it failed.
A
22:26:19.414064 ethertype IPv4 (0x0800), length 26820: 74.125.195.136.https > 10.138.0.12.60790: Flags [.], seq 35556934:35583686, ack 789, win 265, options [nop,nop,TS val 2940395388 ecr 3057320826], length 26752
22:26:19.414076 ethertype IPv4 (0x0800), length 26818: 74.125.195.136.https > 172.17.0.2.60790: Flags [.], seq 35556934:35583686, ack 789, win 265, options [nop,nop,TS val 2940395388 ecr 3057320826], length 26752

B
22:26:19.414077 ethertype IPv4 (0x0800), length 2884: 74.125.195.136.https > 10.138.0.12.60790: Flags [.], seq 34355910:34358726, ack 789, win 265, options [nop,nop,TS val 2940395383 ecr 3057320821], length 2816

C
22:26:19.414091 ethertype IPv4 (0x0800), length 56: 10.138.0.12.60790 > 74.125.195.136.https: Flags [R], seq 821696165, win 0, length 0

...
X
22:26:19.416605 ethertype IPv4 (0x0800), length 66: 172.17.0.2.60790 > 74.125.195.136.https: Flags [.], ack 35731526, win 1408, options [nop,nop,TS val 3057320829 ecr 2940395388], length 0
22:26:19.416626 ethertype IPv4 (0x0800), length 68: 10.138.0.12.60790 > 74.125.195.136.https: Flags [.], ack 35731526, win 1408, options [nop,nop,TS val 3057320829 ecr 2940395388], length 0

Y
22:26:19.416715 ethertype IPv4 (0x0800), length 56: 74.125.195.136.https > 10.138.0.12.60790: Flags [R], seq 3900322453, win 0, length 0
22:26:19.416735 ethertype IPv4 (0x0800), length 54: 74.125.195.136.https > 172.17.0.2.60790: Flags [R], seq 3900322453, win 0, length 0
Segment (A) is a normal data segment, forwarded to the container.
But (B) has a much lower sequence number, about 1MB earlier in the stream, and it is not forwarded to the docker container.
Notably, (B) is also about 1/10 the size of the normal data segments -- we never figured out why that is the case.
Instead, we see an RST segment (C) sent back to dl.google.com.
This situation repeats a few times: normal segment forwarded, late segment dropped, RST segment sent to peer.
Finally, the docker container sends an ACK segment (X) for the segments it has received so far, and this is answered by an RST segment (Y) from the peer, and that RST segment is forwarded to the container. This final RST segment is reasonable from the peer's perspective: we have already reset its connection, so by the time it gets (X) the connection has been destroyed. But this is the first the container has heard of any trouble on the connection, so it fails with "Connection reset by peer".
So it seems that the low-sequence-number segments are being flagged as INVALID by conntrack and causing it to send RST segments. That's a little surprising -- why is conntrack paying attention to sequence numbers at all? From this article it appears this is a security measure, helping to protect sockets behind the NAT from various attacks on TCP.
The second surprise here is that such late TCP segments are present. Scrolling back through the dump output, there are many such packets -- enough that manually labeling them is infeasible. However, graphing the sequence numbers shows a clear pattern:
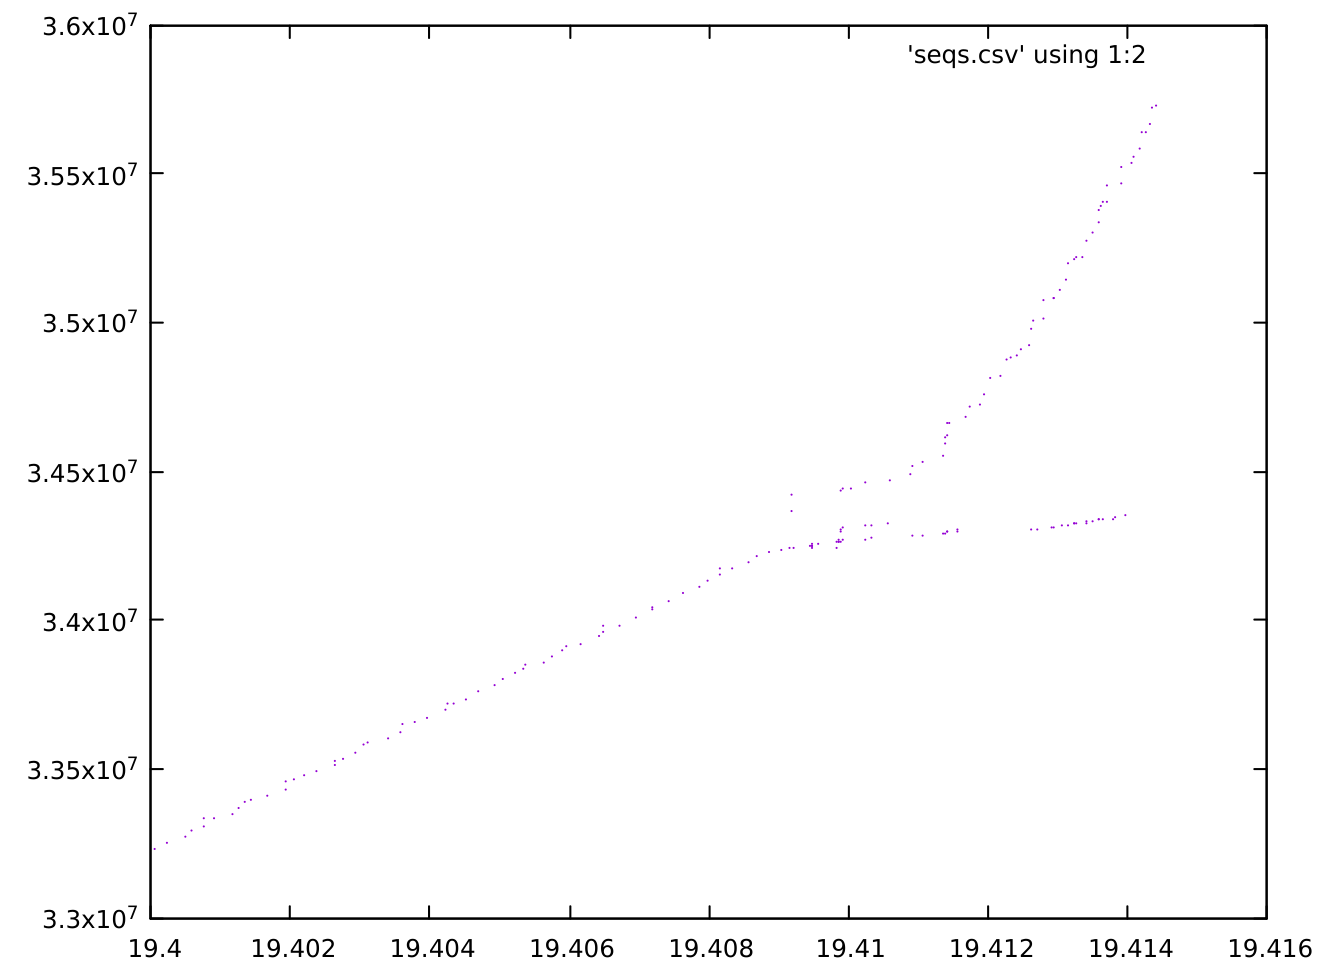
Note that this covers only the last 16ms of the connection (the horizontal axis is in seconds), carrying about 200MB of data (the vertical axis is sequence numbers, indicating bytes). The "fork" in the pattern shows a split between the up-to-date segments, which seem to accelerate, and the delayed segments. The delayed segments are only slightly delayed - 2-3ms. But a spot-check of a few sequence ranges in the dump shows that they had already been retransmitted by the time they were delivered. When such late segments were not dropped by conntrack, the receiver replied to them with what's known as a duplicate ACK, a form of selective ACK that says "I have received that segment, and in fact I've received many segments since then."
Our best guess here is that some network intermediary has added a slight delay to some packets. But since the RTT on this connection is so short, that delay is relatively huge and puts the delayed packets outside of the window where conntrack is willing to accept them. That helps explain why other downloads, from hosts outside of the Google infrastructure, do not see this issue: either they do not traverse the intermediary delaying these packets, or the RTT is long enough that a few ms is not enough to result in packets being marked INVALID.
Resolution
After we posted these results in the issue, our users realized these symptoms looked a lot like a Moby libnetwork bug. We adopted a workaround mentioned there where we use conntrack to drop invalid packets in iptables rather than trigger RSTs
iptables -I INPUT -m conntrack --ctstate INVALID -j DROP
The drawbacks of that approach listed in the bug are acceptable for our uses. After baking a new machine images we tried to reproduce the issue at scale as we had done during the debugging of this issue and were not able to. We updated all of our worker pools to use this image the next day and it seems like we're now in the clear.
Security Implications
As we uncovered this behavior, there was some concern among the team that this represented a security issue. When conntrack marks a packet as INVALID and it is handled on the host, it's possible that the same port on the host is in use, and the packet could be treated as part of that connection. However, TCP identifies connections with a "four-tuple" of source IP and port + destination IP and port. But the tuples cannot match, or the remote end would have been unable to distinguish the connection "through" the NAT from the connection terminating on the host. So there is no issue of confusion between connections here.
However, there is the possibility of a denial of service. If an attacker can guess the four-tuple for an existing connection and forge an INVALID packet matching it, the resulting RST would destroy the connection. This is probably only an issue if the attacker is on the same network as the docker host, as otherwise reverse-path filtering would discard such a forged packet.
At any rate, this issue appears to be fixed in more recent distributions.
Thanks
The Future of Taskcluster
Last week the Taskcluster team met to talk about the future of the platform. We called this the Taskcluster 1.0 discussion and so the first topic up for debate was:
Just what the heck does 1.0 mean anyway?
With that question in mind, we'll cover herein what we've decided we mean when we say that and how we intend to get there. This will be a quick summary of our current position.
What is 1.0
It boils down to a few categories, each of which are interrelated.
No more breaking changes
Obviously a Taskcluster 2.0 will always be a possibility allowing us to break core functionality, but that sort of transition is hard to pull off and will take a very long time. For all realistic scenarios, we'll be on 1.0 forever. This means that we must be quite happy with the core concepts that we use before we move to this release.
Remove deprecated parts
This is less important to be done other than for general ease of maintenance for us and ease of getting-started for others. Before we get to 1.0, anything that we've said is deprecated should actually be turned off. The major example of this is Task-Graph Scheduler. No Taskcluster internal services use this anymore, but some users haven't been moved off of it yet.
Improved self-serve for scopes
The scopes system we have currently works quite well for the purposes it was designed for. Adding new users will require us to make scopes more flexible. This might involve renaming certain concepts, using longer IDs, and rethinking how we structure scopes. In general, the work will be to enable as much self-service as possible. In addition, we'd like to have the auth service itself do authorization (not just authentication) for clients that have Taskcluster credentials. This will be safer and allow for some improvements in general.
Better introduction docs
This is related to the first three goals. Once the basic concepts are nailed down, the process of adding a project to Taskcluster will be streamlined and we should make it easy to figure out how to do so. In addition, once the initial steps are taken, figuring out how to use some of the more complicated parts of Taskcluster should be straightforward. We'll never be as easy to use as Travis, but that's not our goal. We want to handle more complicated projects for which Travis just isn't enough.
What is going to change
This is not an exhaustive list, but covers some of the most obvious work we have ahead.
Index and Artifacts
There's a lot of ongoing discussion here, but mostly we want to make it easier to connect tasks together. Currently we have a well defined way to "export" objects from a task via the artifacts field. However, if you want to use those same artifacts in a downstream task, you must write some code to download the artifacts at the start of your task. This is not a terrible amount of work, but we'd like to see if we can help make this process easier and less error prone.
In addition, the index in general will probably be updated. We are not sure that the default way of indexing via pulse routes is ideal and may move to some other strategy. In addition, being able to index failed tasks and have some limited historical view of tasks may be desirable as well. We have a lot to think about here.
Auth
Everything we're thinking about changing with scopes will mean changes in the auth service. The most noticeable external changes will involve user credentials. We will be reworking the way they work so that services such as Treeherder can keep up-to-date credentials for Taskcluster for as long as they wish to keep a user logged in for. In addition, we'll be better able to support permissions from Github and other providers.
We'll also likely be reworking how scopes are used in general. We will need to do this to be more flexible with things like priority levels in the queue.
What is still being debated
The path forward can take two general paths. First would be to nail down an integration layer on top of Taskcluster that is nicely defined and created specifically for CI use case. The latter would be to make all of our currently existing services "complete" before we move forward. It seems the current focus will continue to be on tamping down the ground around the core, but at some point in the future we may start to think about the integration layer much more.
It is very important that we continue to think of Taskcluster as a meta-CI, in the lineage of Buildbot. Rather than a full CI solution that comes out of the box ready to go like Travis or Jenkins. Keeping that in mind, we will try to make the common tasks much more easy than they are now while still enabling uncommon tasks to be done with Taskcluster. If you have any thoughts on this, please let us know! Now is the time to discuss.
What and Why is Taskcluster
Taskcluster is the task execution framework that supports Mozilla's continuous integration and release processes. Like any system of its size, Taskcluster can be different things to different people. Probably the most common context that it is used in is in its life as a CI system for Firefox at Mozilla. From that perspective, it is an extremely customizable framework for building your own CI system, much in the tradition of Buildbot. Some helpful people have used the framework to build a Github-specific integration much like Travis or CircleCI, so in a sense Taskcluster is like those as well. At the end of the day, the part of Taskcluster that ties all of that together is the platform it provides for running tasks in a cluster of machines -- hence, the hard-to-type and hard-to-say name.
Taskcluster does a lot of hard work. As of the last 30 days leading up to the date of this post, we've done:
Total Tasks
5,229,327

Total Task Time
225.57 years

Unique machines
695,734

Average task duration
40.7 minutes
That covered 6113 try, 1002 inbound, and 134 central pushes, responsible for 2101346, 632790, and 252421 tasks respectively. The task time per machine averages out to about 2 hours per machine. We try to keep machines as fresh as possible (no machine lives more than 3 days), but also try to push machines up as close to the end of billing periods as possible.
We'll cover a few aspects of Taskcluster here. First is our guiding design principles and how they help us build a robust, easy-to-use system. In the next post we'll follow the life of a task as it bumps around Taskcluster. From there we'll see how we use it at Mozilla (in combination with some of our other tools) to solve some classic CI problems. Finally we'll cover some future work.
Guiding Principles
About a year ago the team met up for our confusingly named 2016 Worker Work Week. One of the products of the week was a list of principles that we had been unofficially following up to that point and that we have been using to guide our decision making since then.
Self-service
This goes a step further than just making sure CI configuration is inside user's repositories. In addition to that we provide a flexible permissions system based on something we call scopes. Each action in Taskcluster can be guarded by a set of scopes (which are just strings) that a client must have. Scopes can either be an exact match, or be matched by a splat suffix.
Action Requires: notify.irc.bstack.on_failure
Client Has: notify.irc.*
Success: true
Importantly, clients can assign scopes to other clients if they already posses that scope. So this allows us to endow certain users with the ability to give scopes to other users. Entire ecosystems of scopes can exist within Taskcluster without needing to involve the Taskcluster team itself.
There are a few other ways that this rule manifests, but we'll cut short here.
Robustness
This is not a particularly surprising rule to live by for a CI system. However, anybody who uses a CI system on a day-to-day basis probably knows this is one of the most difficult goals to achieve. I can say as a relatively new member of this team and someone who's worked on a number of other build systems that compared to how rapidly we add features to Taskcluster and how heavily used it is, it breaks quite infrequently. I think this is due to a few of the principles we have in particular:
- No state in our services … ever!
- No running our own datastores … ever!
- Anything that can return a potentially unbounded list must be paginated.
The first two are surprisingly hard to keep and my dinosaur brain constantly wants to break them for one reason or another. Keeping discipline within the team on this point has so far always ended up producing surprising/different ways of solving problems in a manner that still allows us to rely on external providers for the Hard Parts™.
Another aspect of robustness is supporting large, complex to build projects like Firefox. This guides many of the decisions we make and is something that is different between Taskcluster and something like Travis.
Enable rapid change
This is very near-and-dear to our hearts on Taskcluster. It is probably the primary reason something like Taskcluster exists in the first place. Buildbot is an awesome project and when used correctly, can do amazingly complex things. A recurring issue with many installs of Buildbot is that configuration becomes ossified over time. This is due to configuration taking place separately from a project's source code and the configuration being complex enough that generally people become Buildbot specialists.
Taskcluster was designed from the ground up to not have this issue. A single task can easily be designated in a small yaml file and more complex graphs of tasks with dependencies can be built up without too much effort, but in either case all configuration will live in your tree, not in Taskcluster itself.
Another side of this is that Taskcluster itself is easy to change and add features to. We have a few services that are completely maintained by contributors. We also have a number of services that hook into events published by Taskcluster and are run entirely by other teams within Mozilla.
Community friendliness
As mentioned before we have parts of Taskcluster that are entirely contributor run and are looking to expand that as time goes on. Part of this is the Mozilla-y-ness of the project. Pretty much everything happens in public. Anybody can come to our weekly meetings and anybody can sit in our irc channel. We are starting weekly events that are purely for community interaction that are mostly for just hanging out and chatting about semi-related things. The meetings change time every week to make it easy for people all over the world to show up. You should show up sometime and say hi!
The Life of a Task
We've talked about why Taskcluster is the way it is. Now we'll talk about how it works. We'll talk about what a task is and what happens to it. Let's meet our task.
{
  "taskGroupId": "BjadQTTpRiu5RZGBKIIw-Q",
  "dependencies": ["RLBIMCE-SZ-sdrmM5QInuA"],
  "requires": "all-completed",
  "provisionerId": "aws-provisioner-v1",
  "workerType": "taskcluster-generic",
  "schedulerId": "-",
  "routes": [
    "index.project.taskcluster.example-task",
    "notify.email.bstack@mozilla.com.on-failed",
    "notify.email.bstack@mozilla.com.on-exception"
  ],
  "priority": "normal",
  "retries": 5,
  "created": "2017-03-15T16:31:27.771Z",
  "deadline": "2017-03-16T16:31:27.771Z",
  "expires": "2017-06-15T16:31:27.771Z",
  "scopes": [
    "auth:aws-s3:read-write:taskcluster-backups/"
  ],
  "payload": {
    "image": "node:7",
    "command": [
      "/bin/bash",
      "-c",
      "git clone https://github.com/taskcluster/taskcluster-backup.git && cd taskcluster-backup && yarn global add node-gyp && yarn install && npm run compile && node ./lib/main.js backup"
    ],
    "maxRunTime": 86400,
    "env": {
      "FOO": "bar"
    }
  },
  "metadata": {
    "name": "A task in taskcluster",
    "description": "This does a thing in taskcluster",
    "owner": "bstack@mozilla.com",
    "source": "https://something-related-to-this.com/whatever"
  }
}
Hello task, nice to meet you. This format is defined by a JSON schema and has autogenerated docs (as do all of our api endpoints).
The Queue Service
You take that task definition and send it to the taskcluster queue. This is the piece of the system that manages tasks and task dependencies. We can specify in the requires field whether or not the task should block on the prior tasks merely finishing, or whether they need to finish successfully. In our task, RLBIMCE-SZ-sdrmM5QInuA must finish with a successful status before our task will begin. Let's talk about what those funny strings in taskGroupId and dependencies are and what "successful" means a bit more.
The task IDs are generated by clients rather than the server. Our client libraries have some helper functions to generate one when you create a task. They are 22 character URL-safe base64 v4 UUIDs (see RFC 4648 sec. 5). Basically, these are strings that won't collide and you can safely generate as many of them as you want and use them to identify tasks and task groups within Taskcluster. Referring back to the design principles from the first post, we make the client generate these to allow for idempotent retries when creating tasks.
Task groups are for the most part a convenient way of relating tasks that are part of a larger whole together for easy viewing, they don't do much more than that. Dependencies can exist between task groups.
Tasks can resolve in a few different ways that have different semantic meanings. The possible task states are unscheduled pending running completed failed exception. Taskcluster will label tasks as exception if something within taskcluster caused a task to fail to complete and it will automatically retry up to the number of times you specify in retries. Failures that you introduce (say something like a test in your CI suite failing) will cause the task to be failed and these are not retried. If you want to have retries around a flaky test, you build that into your test itself.
The Auth Service
On to some other fields in our friendly task. What are scopes and how do you use them? Every service in Taskcluster can specify that an endpoint needs a client to have certain scopes before it will run. The service that maintains clients and their relation to scopes is called the auth service. The most important endpoint that service provides is a way to validate Hawk credentials. In this manner, we keep all credentials only known by the auth service itself and the client that has them. We can happily add new services to the Taskcluster ecosystem and trust them not to leak credentials. This aligns with our desires to be community friendly from the guiding principles.
As much as possible, we try to have services have no credentials of their own. Each time a service has credentials and it tries to reduce its power to use them on behalf of a client, we have an opportunity for a confused deputy. Avoiding those sorts of situations are very important to us.
Routing Events
One of the more confusing fields in the task definition is the routes field.
{
  "routes": [
    "index.project.taskcluster.example-task",
    "notify.email.bstack@mozilla.com.on-failed",
    "notify.email.bstack@mozilla.com.on-exception"
  ]
}
All Taskcluster services can emit events into RabbitMQ based on certain events. Unsurprisingly, all services can also listen for events. Adding routes to the routes field of a task will cause the queue to emit events on task completion. Our example task here emits 3 routes. The first one is listened for by the index service, which stores the taskId as the value to a key that is whatever the rest of that route is. So in this case, you can ask the index service for project.taskcluster.example-task and it will tell you whatever the most recent task that was labeled that way was. We use this for finding artifacts of the latest builds of a branch for instance. Which routes you are allowed to write to are controlled by scopes to prevent unauthorized overwrites.
The notify.* fields route to the notifications service which can send emails or irc messages. You can ask it to alert you on failures, exceptions, success, or all of the above.
These services also expose an API if you wish to add custom indexing our notifications. For instance, we have users that generate daily reports and send them to themselves with the notifications service.
That brings up one other note, Taskcluster provides a hooks service that allows you to have cron-style jobs that execute based on time. This takes care of common cases like a nightly performance report or daily backups.
Workers and the Provisioner
We keep talking about tasks running, but where do they run and how do they do it? Tasks run on workers. Workers can be many things, but they all share a couple things:
- They ask the queue for work
- They have a way of running that work
- They report back to the queue the status of the work
Generally what this means at this point is an instance of our Docker worker running on a Linux machine in AWS or generic worker on a Windows machine. The payload section of our task is what the worker is interested in. Once the queue gives a task to work on, the worker looks there to see what to do.
{
  "payload": {
    "image": "node:7",
    "command": [
      "/bin/bash",
      "-c",
      "git clone https://github.com/taskcluster/taskcluster-backup.git && cd taskcluster-backup && yarn global add node-gyp && yarn install && npm run compile && node ./lib/main.js backup"
    ],
    "maxRunTime": 86400,
    "env": {
      "FOO": "bar"
    }
  }
}
The task we've been looking at is designed to run on docker-worker. It specifies that it wants a container based on the node:7 image to run the commands listed in the command field. We want the task to be killed after 24 hours, and we want the env to have a variable called FOO with the value of bar in it. It is pretty self-explanatory. How did we know we would be running this task on a docker-worker though?
{
  "provisionerId": "aws-provisioner-v1",
  "workerType": "taskcluster-generic"
}
This tells the queue which sorts of workers should be allowed to request the task. A provisioner is a service that manages a set of machines running workers and the workerType is a definition within that provisioner of a type of worker. That includes things like which OS version, which cloud provider, which version of Docker, and how much space should be available on the machine in addition to which worker client is running there.
We allow for many different worker types. Some of the most well supported provide some great features. Docker worker allows for an interactive session to be started with access to both the command line inside the running task and the screen output. This makes quick work of oftentimes hard-to-debug test issues that only happen in CI but not locally. Again, access to all of this is guarded by scopes.
At this time there's basically one provisioner and it runs an autoscaling group of nodes in AWS that grow and shrink as demand changes in the queue. We are doing a lot of work in this part of our stack to provide more platforms to developers.
Use Cases
Taskcluster does not make a full CI/CD system on its own. Mozilla has quite a few other open-source tools that make up our full set of systems. Some of these, like the service that integrates us with Github are managed by the Taskcluster team, while others are run by other teams within Mozilla.
For the building and testing of Gecko itself, a lot of tools work together to make the system run smoothly. Two of the most important tools here are Treeherder and Orange Factor. These are focused on the tests themselves, which Taskcluster does not concern itself with. They are quite powerful tools, used by developers and the tree caretakers (called sheriffs) alike. Orange Factor is one of the tools we use for tracking flaky tests. The Taskcluster team is occasionally responsible for things that show up in Orange Factor, so we keep a close eye on the dashboard as well.
From there, we need to actually publish new version of Firefox to the world. Balrog, funsize, and beetmover interact with Taskcluster to make updates available for Firefox users when we push new code.
Future Work
Conveniently, we're beginning our quarterly planning now, so it will be easy to see across the entire team what we're going to be focusing on in the next few months.
- Get 100% of Firefox build into Taskcluster
- A QEMU based engine in our worker
- Syncing of Github and Taskcluster permissions
- Real-Time Queue + Worker inspection to track the full lifetime of a task
- Improved security audit tooling and further security hardening
- Redeployability and general cluster management improvements
In general our team is working mostly on finishing the migration from Buildbot to Taskcluster at this time, but as that work wraps up, we'll move onto further integration/core improvements and making operations/redeployability easier.
If you're interested in helping out, here are some good resources:
Announcing Taskcluster Notifications
One of the most requested features for Taskcluster has been a way to be notified on task completion rather than checking back in on the task-inspector tab every few minutes. As of today, taskcluster-notify makes that easy to do. If you have any experience indexing artifacts with routes in a task definition, you're already familiar with the mechanism for adding notifications to your tasks. If not, it's quite easy to figure out!
This service can also be used via a simple api, if you have the correct scopes.
There are (as of today) three types of notifications and four types of filters possible on these notifications.
Notification Types
IRC: This is only enabled on irc.mozilla.org for now. You can specify either a user or a channel to send a notification to upon task completion. You'll receive a message like the following:
Task "Taskcluster Notify Test" complete with status 'completed'. Inspect: https://tools.taskcluster.net/task-inspector/#f0rU3kS7RmG3xSWwbq6Ndw
Email: We can send you both nicely formatted or plain text emails depending on which email client you want to use. You can send to any email address, so long as you have the correct scopes (we'll discuss scopes later).
Pulse: We can also send a Pulse message that is documented on this page. The message is pretty much just the status of the task.
Filters
on-any: This does what it sounds like and will notify you of task-completion no matter how it ends.
on-success: Only when the task completes with no errors will you get a notification.
on-failed: Only when the task fails for non-internal reasons will this be triggered. This could be your tests failing or a lint step failing, as examples.
on-exception: This is triggered when some sort of internal issue happens in Taskcluster and we had to cancel the task.
More thorough (and more correct) documentation of what task statuses are can be found on the docs site.
Route Syntax
But what you've really been waiting for is to know how to use this, so here's a simple set of routes that will do some of the things you might want.
{
  "routes": [
    "notify.email.<you@you.com>.on-any",
    "notify.irc-user.<your-mozilla-irc-nick>.on-failed",
    "notify.irc-channel.<a-mozilla-irc-channel>.on-completed",
    "notify.pulse.<a-pulse-routing-key>.on-exception"
  ]
}
Scopes
If you're using this from the api instead of via a task definition, you'll need some simple notify.<type>.* scopes of some sort. The specific ones you need are documented on the api docs.
If you're using this via task definitions, access to notifications is guarded with route scopes. As an example, to allow the taskcluster-github project to email and ping in irc when builds complete, it has the scopes
queue:route:notify.email.*
queue:route:notify.irc-channel.*
queue:route:notify.irc-user.*
Example
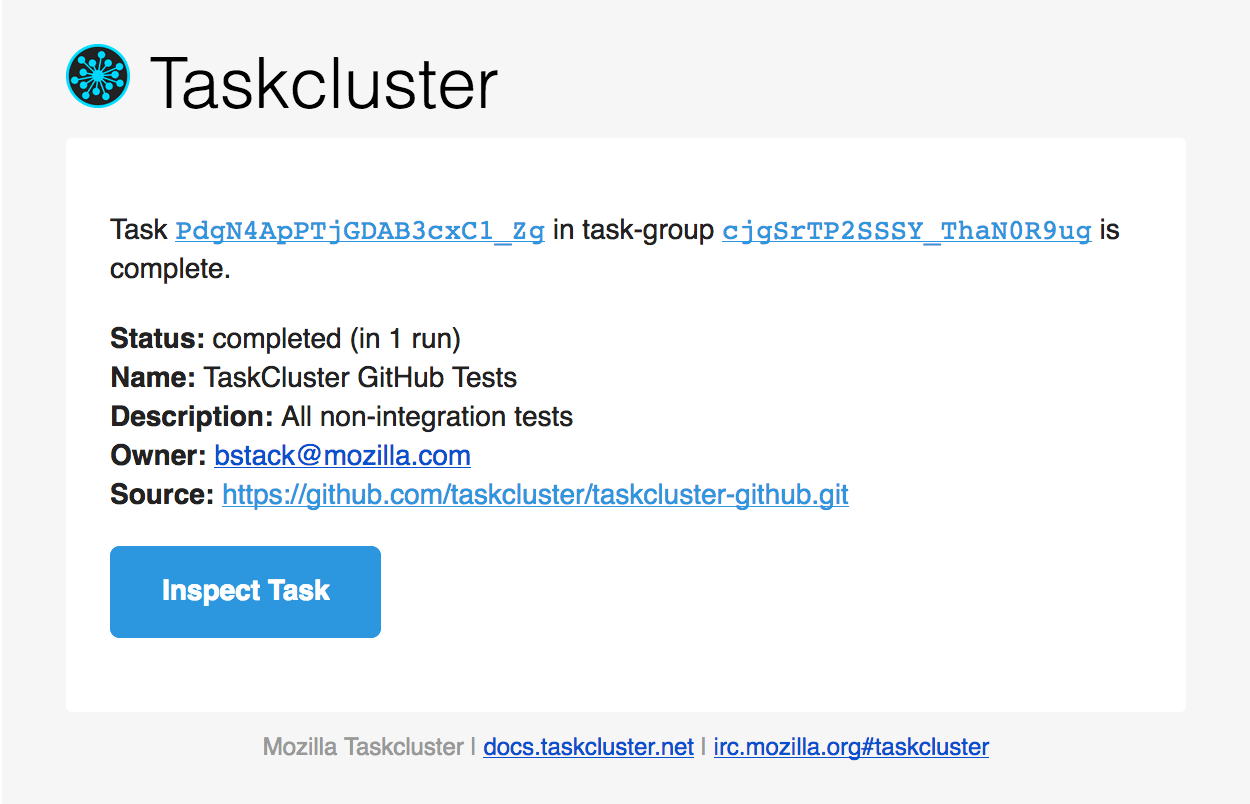
Finally, an example to tie it all together. This is the as-of-this-writing .taskcluster.yml of the aforementioned taskcluster-github project.
{% raw %}
version: 0
metadata:
  name: "TaskCluster GitHub Tests"
  description: "All non-integration tests for taskcluster github"
  owner: "{{ event.head.user.email }}"
  source: "{{ event.head.repo.url }}"
tasks:
  - provisionerId: "{{ taskcluster.docker.provisionerId }}"
    workerType: "{{ taskcluster.docker.workerType }}"
    routes:
      - "notify.email.{{event.head.user.email}}.on-any"
      - "notify.irc-channel.#taskcluster-notifications.on-failed"
      - "notify.irc-channel.#taskcluster-notifications.on-exception"
    extra:
      github:
        env: true
        events:
          - pull_request.opened
          - pull_request.synchronize
          - pull_request.reopened
          - push
    payload:
      maxRunTime: 3600
      image: "node:5"
      command:
        - "/bin/bash"
        - "-lc"
        - "git clone {{event.head.repo.url}} repo && cd repo && git checkout {{event.head.sha}} && npm install . && npm test"
    metadata:
      name: "TaskCluster GitHub Tests"
      description: "All non-integration tests"
      owner: "{{ event.head.user.email }}"
      source: "{{ event.head.repo.url }}"
{% endraw %}
Next Steps
We're working now to enable this to be triggered not only on tasks but also task-groups. Work is ongoing with that project. If you have any questions or suggestions, say hi in the #taskcluster channel on Mozilla irc.
Fun with iMessage
A friend of mine in a group chat was wondering how long people would go between talking or who talked the most often. I became curious and after some quick stackoverflowing I found that you already have all of the data you need locally if you use Messages on OS X. As of today on El Capitan, you can easily hop into the database with sqlite3 ~/Library/Messages/chat.db.
The only tables I ended up caring about to answer this question were message and handle. I'll talk a bit more about how to generate this in a moment, but for now, we can look at Figure 1 and see what the final product is.
From Figure 1 we can extrapolate into the future and see that Pat will need to spend every single waking second sending texts to this group and I'm probably dead, can someone check on me?
There aren't that many steps to getting that plot put together. The first step will be to find which "room" your chats have been taking place in. As far as I can tell, each message is connected to a room via the cache_roomnames column. Your chat's roomname will be something along the lines of chatNNNNNNNNNNNNNNNNNN, where the N's are obviously numbers. I found the room I wanted by getting the last messages I received and then matching up a message that was from the room to its roomname.
SELECT cache_roomnames, text
FROM message
WHERE cache_roomnames != ''
ORDER BY date DESC LIMIT 10;
Once you have your desired room, you can get every message in it that your heart desires. I found that pulling out just a few key columns got me what I wanted, and joining the handle_id column to the handle table gets you a phone number for each participant.
SELECT M.handle_id,
       H.id,
       strftime('%s', M.date + strftime('%s', '2001-01-01 00:00:00'), 'unixepoch', 'localtime'),
       M.text
FROM message AS M
LEFT OUTER JOIN handle AS H ON M.handle_id = H.rowid
WHERE M.cache_roomnames = 'chatNNNNNNNNNNNNNNNNNN'
ORDER BY date;
That '2001-01-01 00:00:00' is necessary because iMessage starts counting time from 2001 for some reason I'll never understand. What you want to do at this point is up to you, but I output it as a csv and go to work from there in Python. One note to keep in mind, messages will occasionally have newlines in them, so you may want to define a newline of your own in your csv output. This will make it harder to read normally, but fixes that issue. I'm almost certain there's a better way of solving it, and if you know one, let me know!
From there it's just some simple scripting to make a histogram of posts per user and plot it however you like. I have a manual phone-number -> human-name dictionary in my code. I'm not sure if there's a way to automate this with wherever Contacts stores its data, but perhaps that's a post for another day.
This got me curious, what does my history look like across everyone I've talked to? Well, here you go:
In Figure 2 I plot the messages per week from anyone who sent me over 150 messages in a week at least once since I've had the phone (arbitrary threshold to keep plot clean). With the exception of Person E and Person F, the top texter during any period of time was the person I was dating at that time. I've not revealed identities here to protect the innocent.
Over the course of a normal week, when are people texting me? We can pretty much steal Github's punchcard visualization and reproduce it Figure 3 with texts instead of commits.
Attacking the Monolith
Following is adapted from a talk I gave at CWRU Link State 2015.
I want to start by making a simple, uncontroversial statement. One that we should all agree on, but one that is often forgotten or ignored by professional software engineers:
Software has a purpose.
This is simple almost to the point of tautology. However, I and most of us who've done this sort of work have lost sight of that many times before. Let me explain what I mean by this.
I've been writing software for a while now. The last two of which were out in San Francisco for that big local reviews website we all know and love. The majority of our code was in a single, large, monolithic project. From when I started there, the size of our engineering team doubled and then doubled again, finishing at over 400 engineers by the time I left. Most of my time there was spent on the team responsible for building and running the tools developers used to develop. We also helped set the policies we had for how to deploy new code and even how to write it in the first place. I was involved in quite a few technical and policy decisions over the course of my time there and was a part of successes and failures. Many of both of the outcomes came as a result of either remembering or forgetting that software has a purpose.
From the moment you start reading about or being taught about how to write software, you learn that modularity is important. Separation of concerns and interfaces, objects and APIs. A natural outgrowth of this is a Service Oriented Architecture. I've worked on and built both monolithic and SOA projects. I've worked on the underlying infrastructure of both as well. I've found a tendency over time for orthodoxies to build up around both camps. Software engineers, I have found, have a penchant for orthodoxy.
I was lucky enough while I was in school to have worked for a networking researcher who spoke of engineering trade-offs religiously and at every opportunity. It's easy as an undergraduate computer major to fall into the trap of thinking there is one correct solution to every problem. We are all told of time and space trade-offs, but in the vacuum of a test, there is only one correct answer.
A SOA has many enticing positives, but also comes with drawbacks. It also requires you to enter a different headspace. While you win strictly enforced boundaries between different elements of your system, you pay for it by needing to find a way to enforce strict interfaces. While you win fine grained scalability and flexibility, you must now build and maintain a robust service discovery layer, not to mention the actual transport in the first place. While you win the ability to use the right tool for the job, you pay for it by expanding the knowledge surface areas needed by your engineers; polyglot engineering requires frequent context switching by human beings, which will prove costly
On the topic of testing (a topic very near and dear to my heart), I have found that engineers will want to build themselves false safety nets and reach across nicely defined boundaries in an effort to prevent any regressions from occurring. The warm fuzzy blanket of a proliferation of end-to-end, integration, and acceptance tests results in a combinatoric explosion in the number of tests and requires you to run disparate codebase's tests any time you deploy any service. Not even unit tests can save you: make them too brittle and they will be nearly tautological, required line-by-line changes to tests every time you change the code.
My coworkers and I once came across a est that was designed to prevent PII from leaking into our logs. When an engineer tasked with upgrading an underlying library caused the test to fail, they simply inverted the condition and made the test pass. The line above the regex was a comment stating, #Don't allow PII in our logs! The mistake was only found weeks after the code had been running in production. Remember: tests only test what you tell them to.
It is tempting to blame the engineer who made that change; to laugh at them or scold them. However, if we're being completely honest with ourselves, we know that this sort of thing is a common mistake and that we all do it all of the time. The first thing a software engineer must recognize is that human beings suck at writing code. I is an inherently difficult process for our minds to create logically correct statements. There are about as many techniques that claim to alleviate these issues as there are techniques that generally fail to do so.
Nothing can save you. Accept failure.
But there is hope.
Now, given that you will fail, what can you do about it? The most important thing you can do is reduce your time to recover from failure. This has two parts to it: First is being able to know when you are failing. Second is to have a way to undo or fix your bad things as soon as you can. Most major failure situations occur when we (human beings) change code.
These two goals go hand-in-hand. Monitoring checks on your production code (not just "does it return a 200") are very conceptually similar to the tests you would normally be writing, but they run against something real. There will always be differences between your development or staging environment and your production one. Obviously not all software is a website, but a heck of a lot of it does communicate across a network with a server in some way. Even if your application is completely standalone, it can still phone-home (for better or worse) to report failures and metrics.
These are some of the most powerful things you can do as an engineer. Detecting failures once in happens is equally important to preventing failure in the first place. At that big reviews site, the CEO and VP of engineering were brothers. A fairly common occurrence was getting bug reports from their mother. These obviously became high priority bugs almost instantaneously. Don't let one of your primary lines of defence be your CEO's parents. Everyone will be less happy that way (most of all their parents).
At that company, our first line of defense was testing. In our attempt to alleviate failure, we ended up with almost 60,000 tests that would be run whenever a developer made changes and also before a deploy.
We invested a heck of a lot of computing power and developer effort in keeping these tests fast and un-flaky. Through a judicious application of well over 100 of Amazon's largest instances and a team of 4-8 engineers (who are more expensive than those machines) we cold run all of those tests in about 20 minutes. We applied all sorts of other efforts to reducing the flakiness of the tests. When there are false positives for test failure, you will miss the true positives more frequently.
Writing good tests is really, really, really difficult.
Even with all of those tests and a short stop in a staging environment before a deploy, we would still see multiple failures in production per week. We strove to deploy 3 times a day, every day. Each deploy would contain something like 15 branches. A failure when we got to prod would be extremely costly in terms of developer time. Deciding which failures were worth abort a deploy for was a stressful and difficult decision. Oftentimes a failure could've been fixed in a few minutes by rolling forward, but taking all of that time to run the tests, not to mention fixing them in the first place, generally meant that aborting was the less costly choice.
This brings us to an important question. A website or any piece of software is really made up of different functions. Not in the programming "function" sense, but in the user facing sense. As an example, on that big reviews site, you could:
- read reviews
- write reviews
- upload pictures
- view pictures
- signup
- login
- chat with other users (how many of you knew we had that?)
- search for businesses
- search for users
- claim a business as your own
- track how users were interacting with your business
- buy ads
- view ads (most important!)
And that is just a partial list. So, the question is
How important is each part of the site in relation to each other?
As a software engineer, it is embarrassing to have something you are working on be wrong. Something about the programming mindset forces us to hone in on minutiae and obsess over getting it right. Our deploy system had tags you could apply to the equivalent of a pull request. A common and well understood tag was "Urgent." This meant that the change should be deployed ASAP, to the point of jumping in line before other requests or perhaps even being deployed on its own. The intended purpose for the tag was identifying requests that could stop us from actively losing money or stop something really bad from happening. If essential functionality was broken, this would be the appropriate tag to use. However, more often than note, I saw it being used for requests the really should have been tagged, "Embarrassing." A button being the wrong color, mis-formatted text, or a stray comment that was ultimately harmless. Did users really care about these issues? Probably not. Did these issues really require and urgent deploy? Probably not.
It's really easy to get sucked into your little bit of the puzzle and think that it has to be perfect. I've been guilty of this more than once. I think it is only natural for people who take pride in ownership to go beyond reason once in a while. We all need to remember, at the end of the day
Software has a purpose
Given that software has a purpose, what sort of decisions can we make? One of the most important things you will all decide in the next couple years (or next couple months) is where you will be applying your trade after you graduate from here. A common thought among graduating CS kids when I was here is that all we were looking for was a "fun problem." Combine a fun problem with great compensation and we were sold. I want to argue that these should take a back seat to something more important. Whether you end up continuing into grad school, working for a company, working for the government, or something else entirely, the software you create and maintain has a purpose. Keeping that in mind and aligning that with your personal moral compass will do a lot for the world and keep you content as you work hard to keep the software working. This is not to say that we should ignore fun problems and compensation (particularly if you have student debt to pay back), but we should strive to find a way to help people in the process.
I haven't found how to do this best yet, but I promise I'll keep looking.